Why “Paceometer” Beats Speedometer for AI Adoption
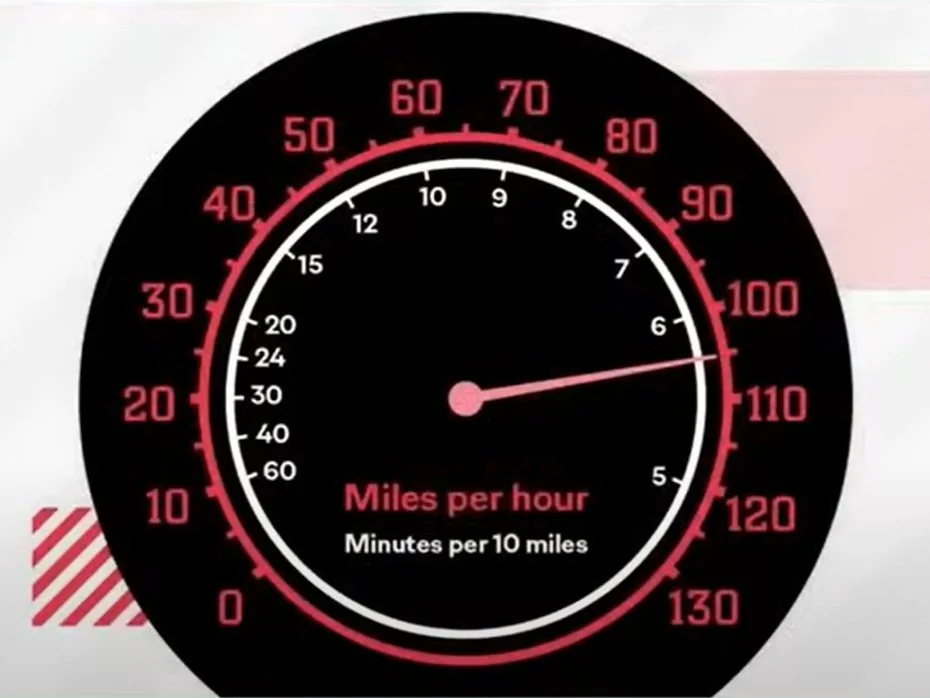
When we talk about business performance, we often fixate on “how fast” we’re moving, our speed. But as ad legend Rory Sutherland reminds us, what matters more is the paceometer: the relationship between speed and distance. In other words, a small bump at 80 mph barely shortens your trip, whereas a big boost at 20 mph can halve it.
Let’s apply Sutherland’s insight to AI adoption. You’ll see why organizations with sluggish processes gain far more from even modest AI-driven acceleration, and how to spot and measure those opportunities in your own teams.
The Paceometer Paradox
Speedometer view: “We went from 80 to 90 mph—only a 12.5% gain. Meh.”
Paceometer view: “At 20 mph, a 10 mph boost cuts your travel time by 25%. Huge!”
Key takeaway: If your process is already sprinting, AI may offer incremental benefit. But in lagging workflows, even small AI “turbo boosts” translate into outsized time savings.
The Hidden Drag of Information Search
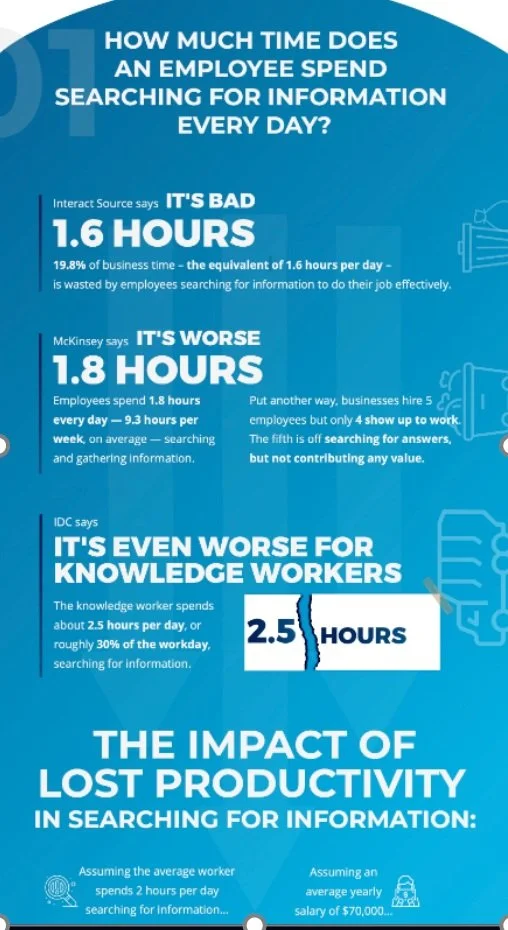
Studies show knowledge workers waste between 1.6 and 2.5 hours per day just hunting for information:
1.6 hrs/day (Interact)
1.8 hrs/day (McKinsey)
2.5 hrs/day for heavy knowledge roles (IDC)
That’s 30% of your day spent in the “slow lane” before any AI even arrives.
When “Busy” Becomes a Bottleneck
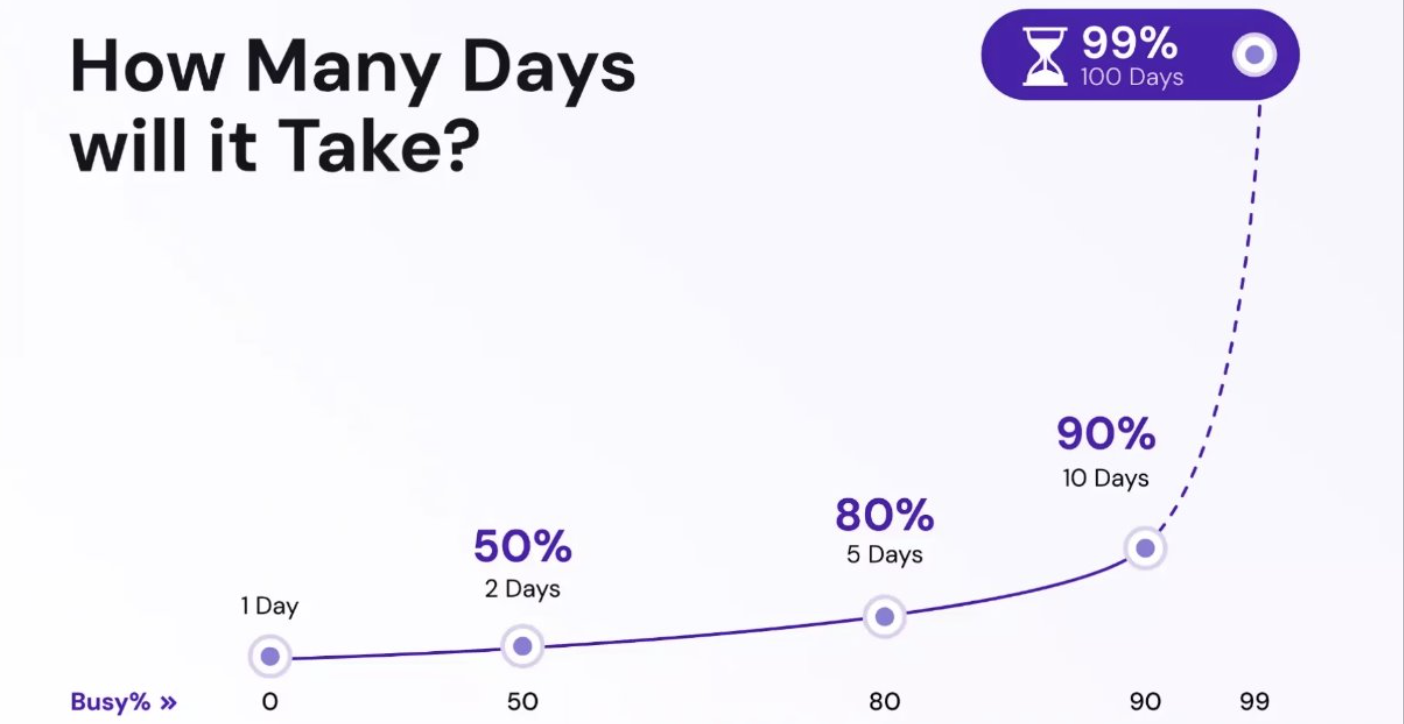
Another dynamic: workload allocation. A task estimated at 8 hours can stretch into 10 working days if the assignee is 90 % committed elsewhere.
Free resource: 8 hrs task ⇒ 1 day
90 % busy: 8 hrs task ⇒ 10 days
This illustrates how capacity constraints amplify delays—exactly the kind of friction AI can alleviate when deployed smartly.
How long will it take for someone to complete an 8 hour task?
Even saving 5 hours per week per person scales up quickly:
ROI of Saving time
Mapping the Paceometer Curve
Baseline cycle-time (X-axis): From 1 day (fast) to 10+ days (slow).
% Improvement (Y-axis): Plot your AI pilot’s delta.
Paceometer insight: The curve will slope upward—slow processes see greater % gains.
Designing Your AI Sprint
Identify slow lanes: Target processes with longest cycle-times or heaviest capacity drag.
Pilot & measure: Use process-mining logs and time-motion tracking to capture pre- and post-AI metrics.
Calculate delta: % reduction in cycle-time and hands-off, difference-in-differences against control teams.
Overlay ROI: Convert saved hours into dollars.
By focusing pilots on your “20 mph” workflows, you’ll prove ROI fast and build momentum for broader AI scaling.
Rory Sutherland’s paceometer isn’t just clever car lore. It’s a blueprint for where and how AI delivers impact. Seek out the slowest moving parts of your operation. Measure, pilot, and quantify. You’ll find that turbo-charging a 20 mph process yields a far greater competitive edge than squeezing extra speed from an already fast engine.


